
Demand and Supply is the most important topic in A Level Economics as it provides the basic foundation for your future topics like Market Failure and Macroeconomic Policies in your Year 2. If you can master this topic well, it can also be used to explain almost any articles that you read on your Straits Times!
One huge problem that most students do not understand about Demand and Supply is the Shifts vs Movements of respective curves. A movement among the curves are caused Price Factor and respective Law of Demand and Law of Supply (refer to lecture notes) while a shift in the curves are caused by Non – Price Factors (refer to lecture notes). An example for a shift in demand for Apple iPhone could be:
- Change in Taste – more people are adopting iPhone because of it iconic symbol of being assiociated to cool and good support from the Apple Store;
- Increase in Price of Samsung Note – an increase in the price of close substitutes will result in a higher demand for Apple iPhones.
As you can see, both are not related to Price Factors.
The main purpose of learning both Demand and Supply will be to find the intersection of both curves and uncover the equilibrium price and equilibrium quantity of a commodity, say iPhone.

Many students mainly forget to illustrate the equilibrium price and equilibrium output on their drawn diagrams, resulting in poor relevance to their essay.
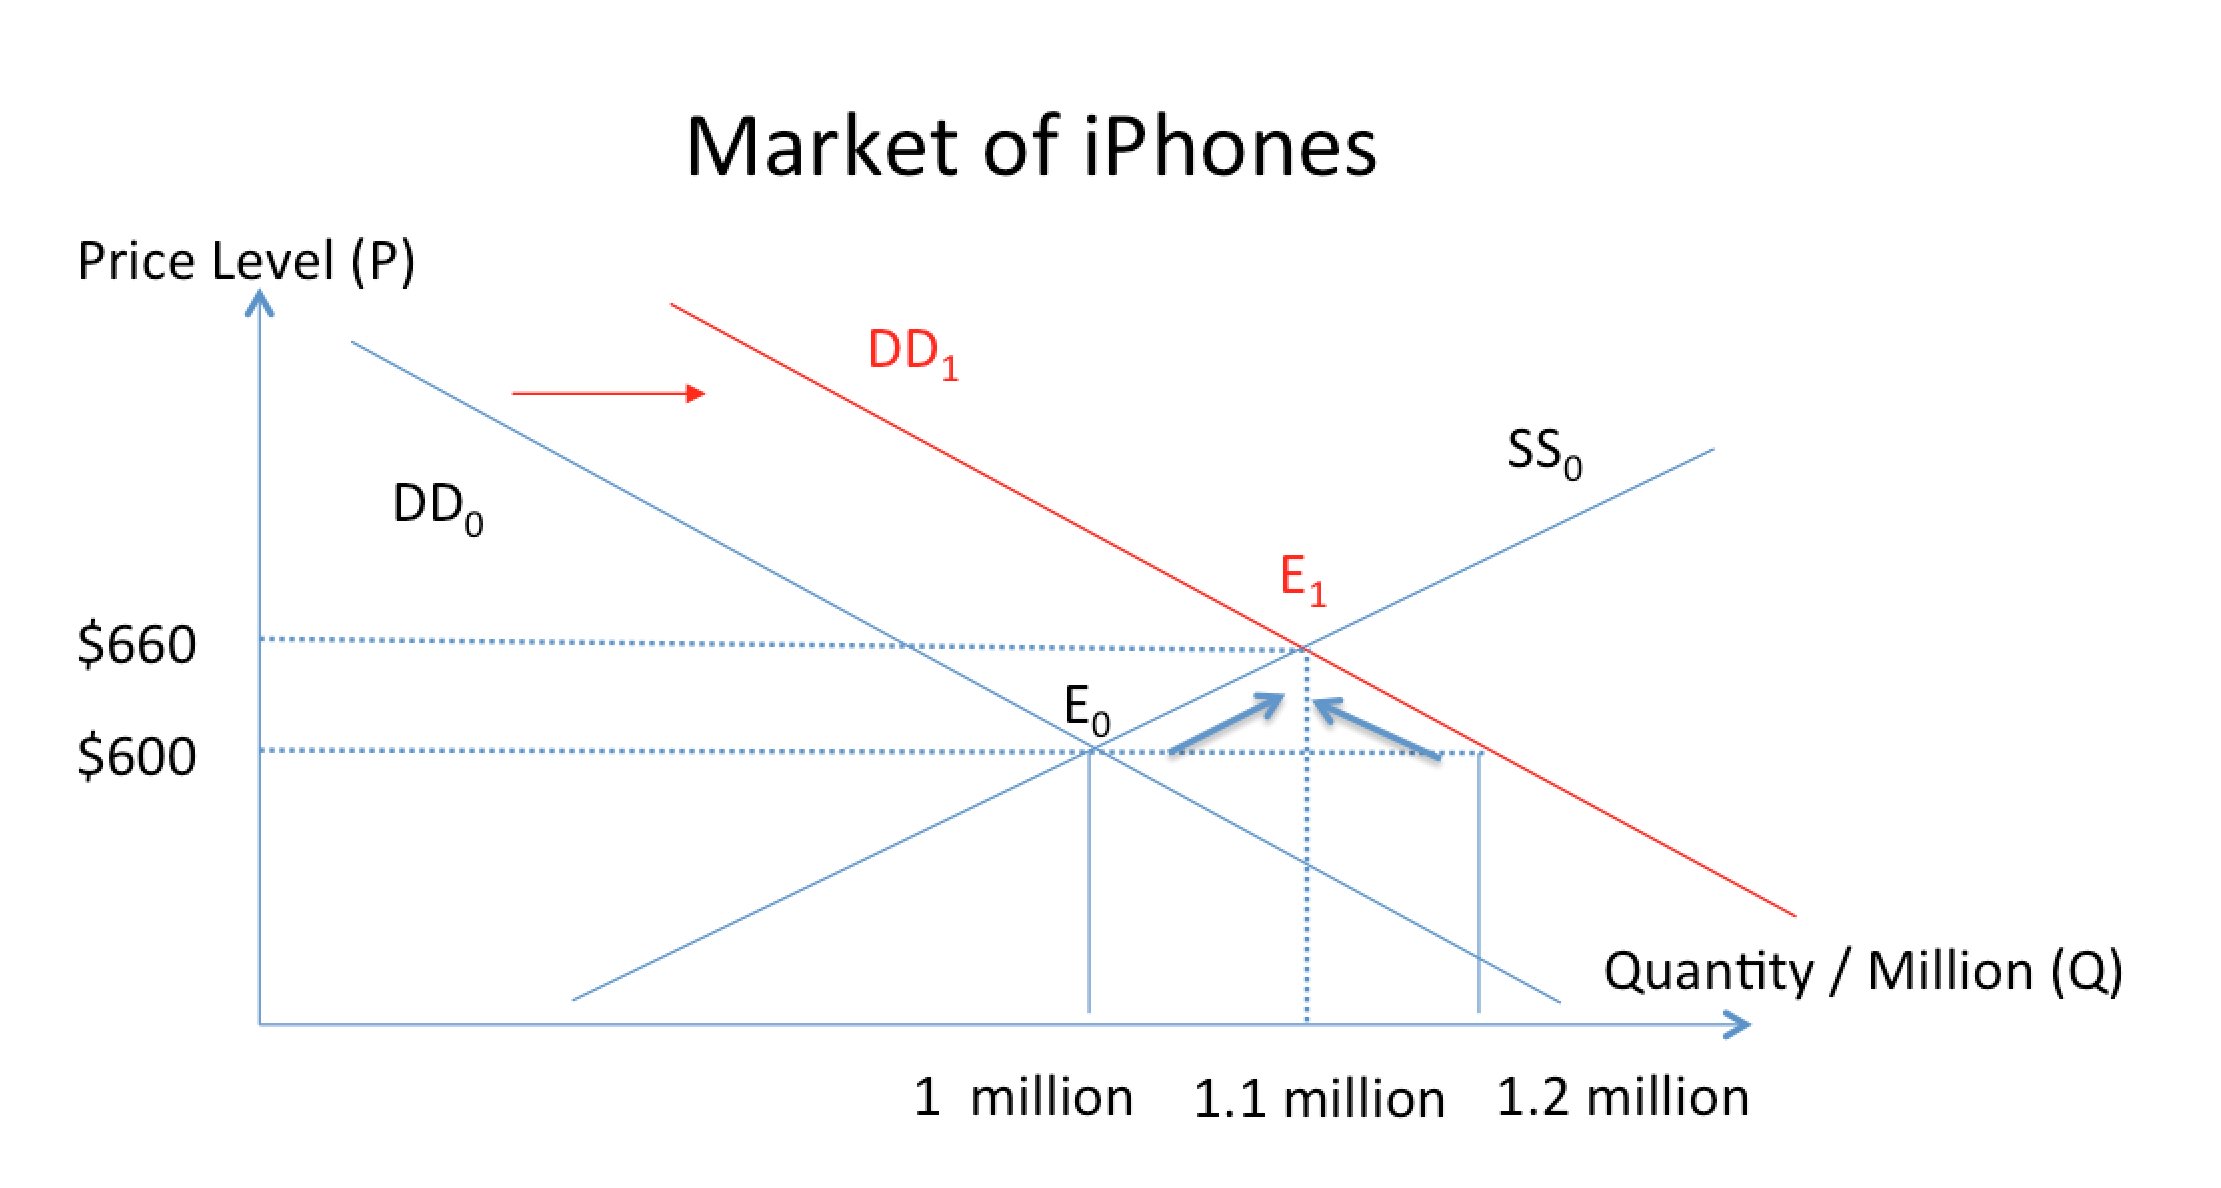
In the above illustration, the original equilibrium price of iPhone is at $600 and equilibrium quantity is at 1 million units. However, when the price of Samsung note increase, ceteris paribus, demand for iPhone will increase as iPhone and Samsung Notes are close substitutes and Samsung users will switch from their Notes to iPhones. At $600, the iPhone suppliers are only keen to supply up to 1 million units while demand for iPhones is at 1.2 million units. This will cause the iPhone users to slowly bid up the price as they can’t wait to get hold of an iPhone. As they bid up the prices, more suppliers are willing to produce more iPhones as they are profit driven and this results at a final equilibrium at $660 with 1.1 million units produced (the other 0.1 million iPhone switchers will not be able to afford $660 and will be left out of the market.
In our A levels Econs classes, we will frequently practice on diagram drawings and also teach you how to make full use of your diagrams to enhance your essay writing skills. You can find out more about our small group classes!
[aio_button align=”center” animation=”none” color=”blue” size=”small” icon=”none” text=”JC Econs & Schedule” relationship=”dofollow” url=”https://aceyourecons.sg/jc-economics/”]
[aio_button align=”center” animation=”none” color=”red” size=”small” icon=”none” text=”Poly Econs” relationship=”dofollow” url=”https://aceyourecons.sg/poly-economics/”]
[aio_button align=”center” animation=”none” color=”orange” size=”small” icon=”none” text=”Back to Home” relationship=”dofollow” url=”https://aceyourecons.sg/”]